
Main resistance
When price approaches from below, watch whether it rejects, pauses or breaks and holds above. It is an observation area, not an automatic short.
GAMMA FLOW RESEARCH · ATAS QUICK START
If you already watch Call Wall, Put Wall and Zero Gamma, keep that workflow. The additional Research layers are context; they do not all need equal attention.
REAL ATAS VIEW
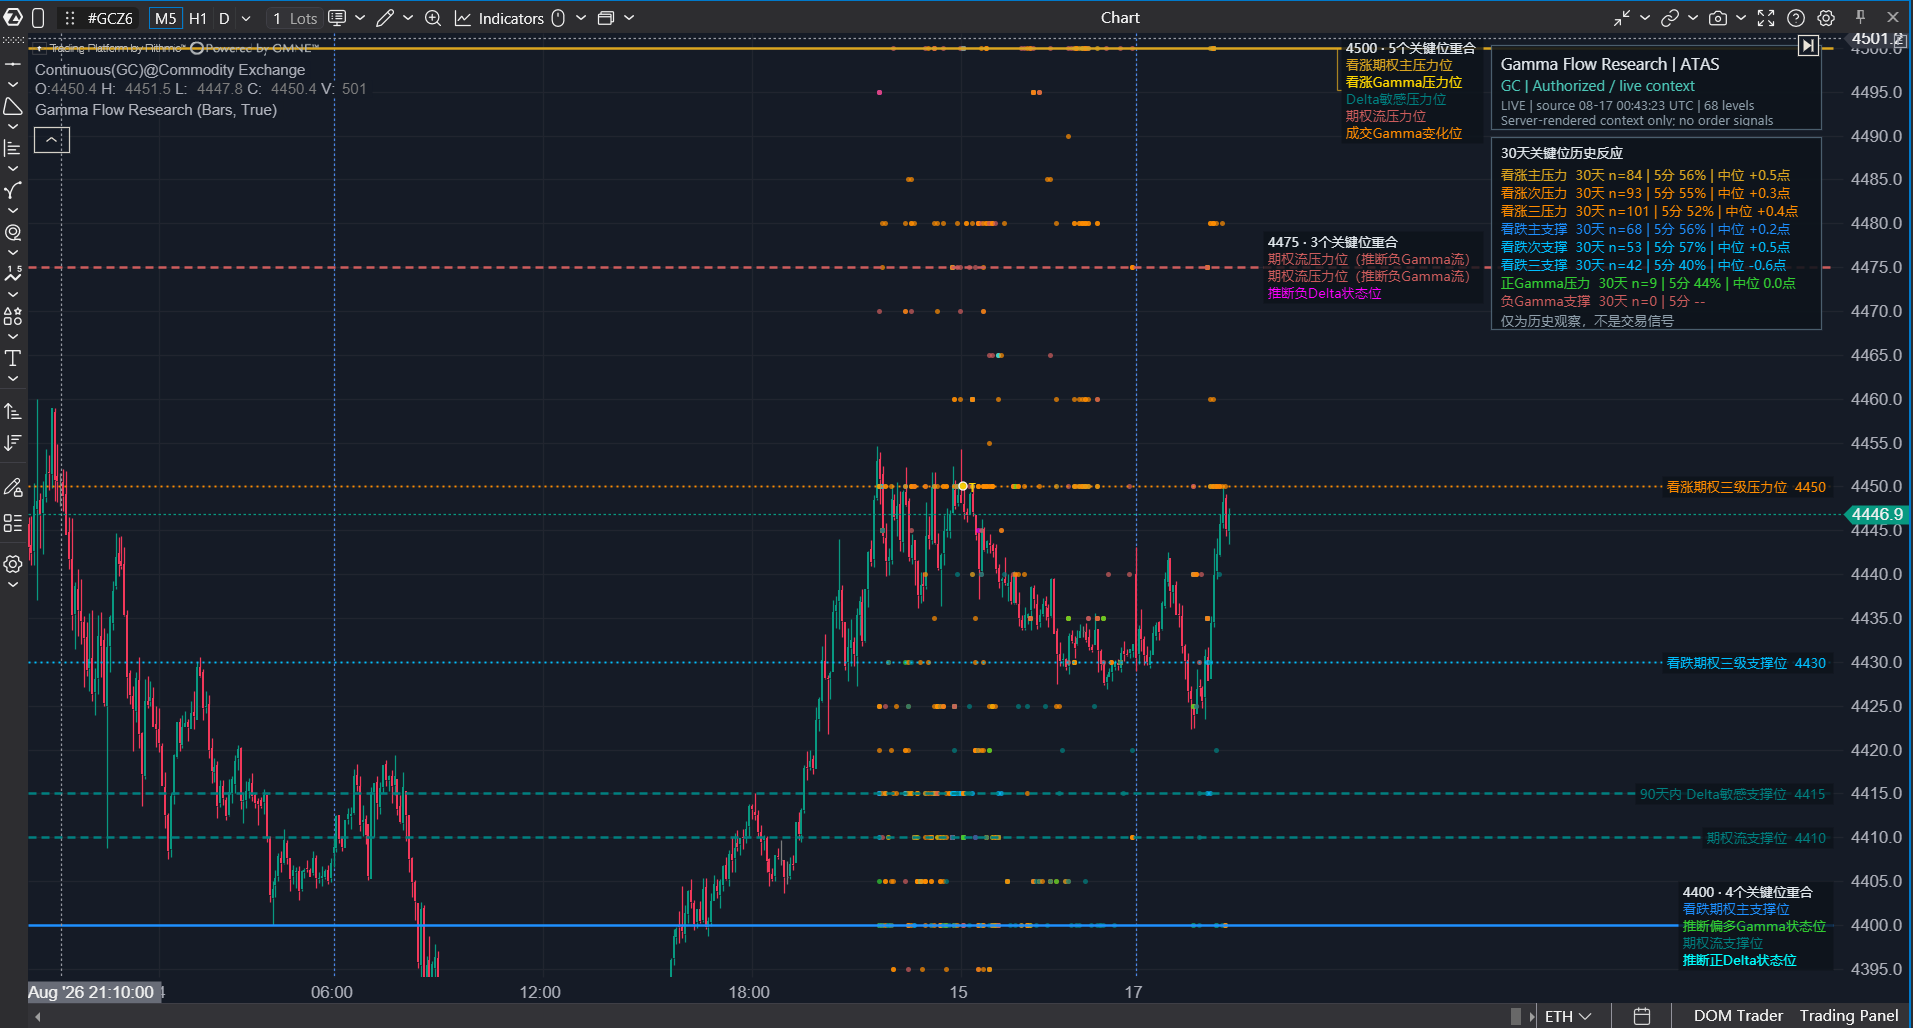
The image below is a real Gamma Flow Research state on GC, not a fabricated mockup. Values and availability change with the market-data state.
MINIMAL VIEW
Distance and the current label matter more than memorizing every model name.
When price approaches from below, watch whether it rejects, pauses or breaks and holds above. It is an observation area, not an automatic short.
When price approaches from above, watch whether it finds support or breaks and remains below. It is an observation area, not an automatic long.
Use the nearest Gamma flip as a model-state reference. Do not assume that it must behave as support or resistance.
Simple rule: find the nearest major resistance above price, the nearest major support below price, and then the nearest Gamma flip between or around them. Always follow the label currently shown on the chart.
60-SECOND CHART READ
Use this order every time. The indicator supplies context; price behavior and your own risk rules still control every decision.
Check the nearest active resistance, support or Gamma flip, plus the source time and availability state. Ignore distant levels first.
If several current levels overlap, treat the area as concentrated context—not a guaranteed reversal.
Use 14-day dots for level movement, then read the 30-day sample count, five-minute reaction rate and median move. A small sample or -- is not evidence.
Look for rejection, acceptance, a clean break or a reclaim before applying your own entry and risk rules. A touch alone is not a signal.
CLEAN FIRST VIEW
These settings keep the current map and reaction summary while hiding denser historical detail until you need it.
Keep the active horizontal levels visible. This is the core map.
The colored dots show earlier level locations. They are not historical entries.
Touch, break and reclaim markers add detail. Turn them on after learning the main levels.
Keep the compact observed-history summary as background context.
Use plain-language Chinese labels first, or switch to English whenever preferred.
ES/MES, NQ/MNQ and GC/MGC are normally recognized automatically.
30-DAY PANEL
Example: 30D n=84 | 5m 56% | med +0.5pt. These are completed historical observations, not a forecast.
Eighty-four touches of this level type had enough follow-up data in the latest 30-day archive.
Fifty-six percent of completed touches were moving away from the level about five minutes later. This is not a strategy win rate.
The median normalized five-minute move was +0.5 points. It is not the maximum bounce and does not include an entry, stop or target.
For a resistance touched from below, moving down is “away.” For a support touched from above, moving up is “away.” Positive values favor movement away from the level; negative values favor passage through it.